The Infographic History of the World by Valentina D'Efilippo & James Ball. Firefly Books, 224 pages, $35.
Since ancient times man has used drawings to communicate information. The start of the modern era of information graphics has been credited to William Playfair who invented the line graph and bar graph in 1786, and later pie charts and circle graphs.
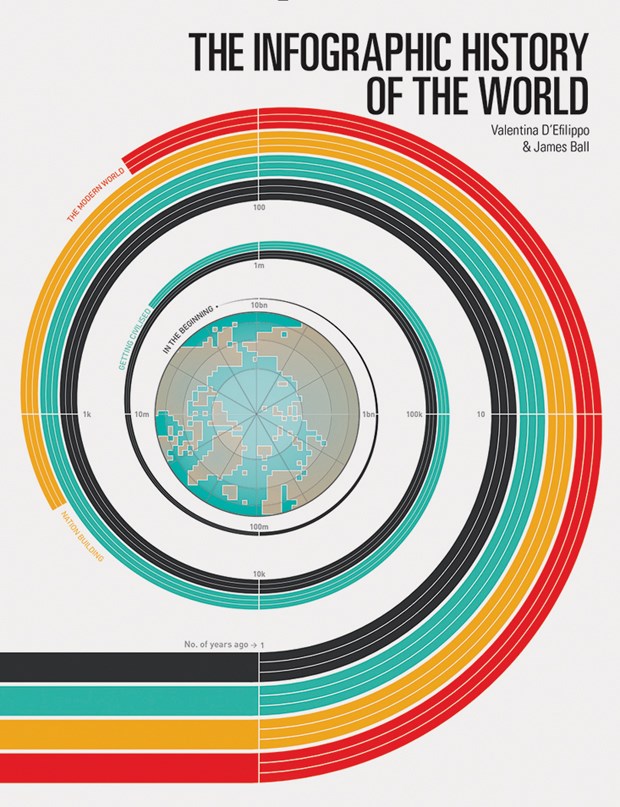
We have come a long way since then and authors Valentina D'Efilippo and James Ball celebrate the many unique ways that information can be visually shared in this entertaining look at the history of the world. They present their data in four sections: In the Beginning, Getting Civilized, Nation Building, and The Modern World. Within those categories they look at a wide range of topics covering everything from the Big Bang theory to divorce rates around the world.
Using illustrations relating to the statistics allows for the viewer to instantly grasp what is being measured and to quickly understand the ratio between the numbers. D'Efilippo and Ball manage to provide an enormous amount of information by distilling it down to these colourful and highly effective graphics.


